Posts

Showing posts from April, 2020

Resource Allocation and Utilisation: Corporate Profitability meets Economic Objectives

Image
One of the key issues that the field of economics addresses is the optimum allocation and utilization of resources. How do we choose between competing objectives when our resources are limited ? How do we transform scarce resources in to productive outputs and at what cost? In spite of all the advancements of mankind in most fields, these fundamental questions of economics still persist. In a free market economy, the burden of the choice between competing projects/undertakings falls on individuals and businesses. At least once in a while, it is necessary to assess if our collective decision making is navigating us in the right direction. So how do we know if our micro economic decision making enhances broader welfare ? One of the key indicators of efficiency in resource allocation and utilization is corporate profitability. In this context, take a look at these graphs on the basis of data provided by Prof. Damodaran . (Reference and Acknowledgements: Prof. Damodaran's blog post ) O...

Implied Equity Risk Premium for S & P BSE Sensex

Image
Based on Prof. Damodaran's implied equity risk premium for the US market, an equity risk premium for the Indian equity market has been calculated in the spread sheet below. For the calculation of historical equity risk premiums actual dividend yields, nominal growth rate and the yield on 10-year benchmark bond for the respective years have been used. Implied ERP for S & P BSE Sensex The methodology for the calculation of ERP is available on Prof. Damodaran's blog.  Implied equity risk premiums are akin to bond yields for bonds, they are inversely proportional to stock prices or index level. Current implied equity risk premium is 1.13% which is actually lower than previous estimates  since earnings growth rate (nominal GDP growth rate) has been slashed to 6% for the current year due to covid-19, 10.5% for the subsequent years before reaching a steady state growth rate of 6% in the long term. The average implied ERP for the period 2010 to 2019 is 2.23% vs the current ERP of ...

Microsoft: Key Financial Ratios and Metrics

Image
BETTING BIG ON THE CLOUD Microsoft is betting big on its cloud revenues but it faces increased competition from Amazon, Google, Sales Force, IBM, Oracle among others. If we combine Microsoft's Server Products & Cloud Services  segment and Office Products & Cloud Services  segment into a new segment called Cloud and Related Services, it accounts for 51.17% of the revenues for the year ended in June 2019. The Cloud related services segment grew at a CAGR of 14.47% in the last three years. Windows is the second largest contributor to Microsoft's revenues after cloud, accounting for 16.21% of the total revenues for the year ended in June 2019. The 3-year segment CAGRs are shown in the figure below. Based on these figures, it is assumed that Microsoft is going to transform from a growth company to a mature company in the next five to ten years. (unless they pull off another high growth segment!) Having said that, it is important to note that Microsoft invests heavily in r...

Microsoft:Revenues and Product Mix

Image
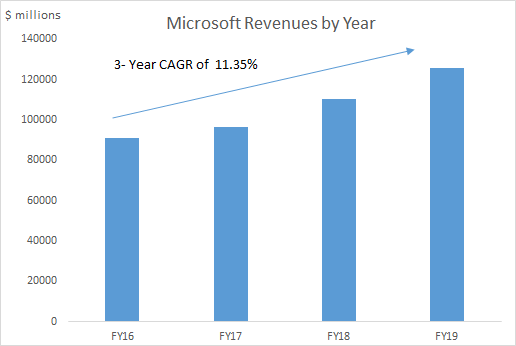
There are very few companies on the face of this planet that have impacted our daily life and Microsoft is one of them. Today it is hard to imagine any workplace or home anywhere in the world without Microsoft products or services. Over the decades Microsoft has transformed it self from an operating system software provider to a commercial cloud solutions giant.   Microsoft reports its financials from July to June each year unlike most companies which report financials by calendar year. Microsoft's revenues for YE June 2019 clocked $ 125.843 billions growing at a CAGR of 11.35%. Microsoft revenues for the trailing twelve months ending on Dec 2019 added up to $ 134.249 billions which are classified into three segments as shown below. As per Microsoft's Annual Report 2019 the following is the description of the composition of their segment-wise revenues: Productivity and Business Processes Productivity and Business Processes segment consists of products and services in the portf...

Correlation between gold prices and equity indices

Image
Gold continues to be the safe haven during times of distress. No wonder India is among the highest importers of gold in the world along with China.  In the charts below, correlation between monthly changes in gold prices and equity indices has been shown for three time periods - since inception of the index, 10-years and 5-years.  In the last 5-years gold has shown low to moderate degree of negative correlation with every other equity index on BSE. Gold prices have shown a correlation of 0.00, -0.07,-0.15 with Sensex since inception, 10-year and 5-year periods respectively. In a globalized financial market, gold is the among the very few asset classes that offers a very low or moderately negative correlation with equities.